 PlugPress
Loggle Reports, Visitors, and Comparisons
The dashboard gives you the summary. These features let you dig into it — and since Loggle 1.2.0 they all live on the same page, so nothing is more than one click away.
Reports
Click Details on any dashboard card and the full report slides in from the right — a complete, sortable table over the same numbers, without leaving the page. Press Escape or click outside it to close.
The eleven things you can break traffic down by
Reports are grouped into three tabs.
- Sources — Channel, Referrer, Campaign
- Audience — Country, Browser, Operating system, Device
- Pages — Page, Entry page, Exit page, Exit link
The six numbers you can measure them by
Click any column heading to sort by it.
- Visitors — individual people.
- Page views — pages opened.
- Conversions — payments recorded.
- Revenue — money earned.
- RPV — revenue per visitor.
- CVR — conversion rate, the share of visitors who bought.
Why RPV is the useful one
Revenue alone rewards whichever channel sends the most people. Revenue per visitor tells you which channel sends the best people.
A channel sending 100 visitors who spend £500 is worth more than one sending 5,000 visitors who spend £600. Sort by RPV and that becomes obvious immediately.
You can measure any of the eleven breakdowns by any of the six numbers. “Which pages earn the most revenue per visitor” is a question most WordPress analytics tools cannot answer at all.
Searching a report
Use the search box above the table to filter rows. It matches what you see, so searching “United” finds United States and United Kingdom.
Visitors
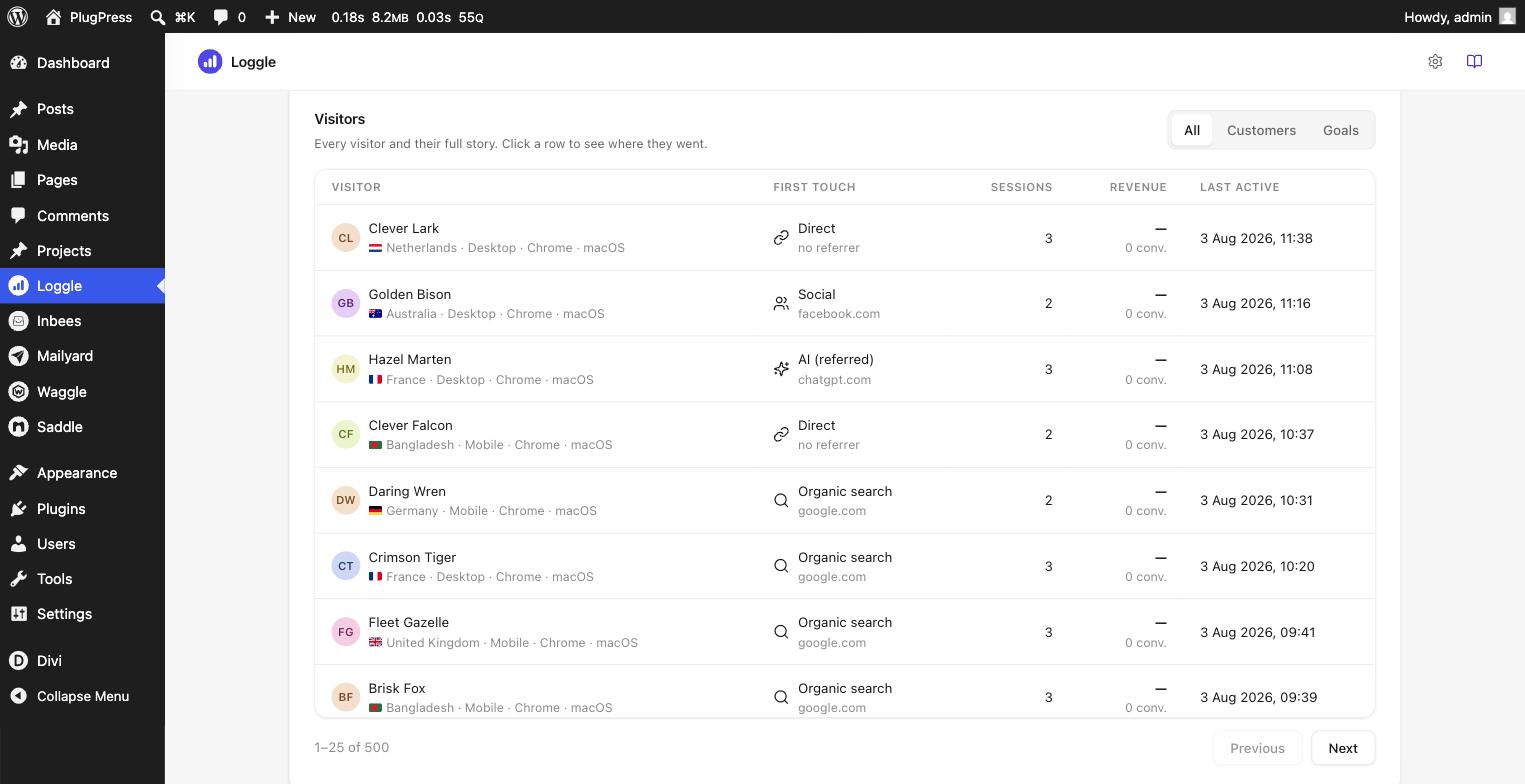
The Visitors panel sits at the bottom of the dashboard, always visible, with three tabs. All lists every visitor, newest activity first — this is where you see your whole site the way visitors experience it, and work out why someone did not buy. Customers narrows the list to people who bought or completed a goal, newest conversion first. Goals shows your goal numbers.
The list
Each row shows:
- A generated name and avatar, such as “Coral Stork” — an invented label, explained below. Paying visitors wear a Customer badge in the All tab.
- Their country, device, browser, and operating system
- The channel and referrer that first brought them to you
- How many separate visits they made
- How much they spent, and across how many payments — a visitor who never paid shows a dash, not money
- When they were last active (in the Customers tab: when they last converted)
The story
Click any row — buyer or not — and that person’s full history slides in from the right. You will see:
- A first touch summary — the visit Loggle credits for any revenue.
- Every visit, grouped as a separate session, in order.
- Every page they viewed, with how long they stayed.
- Any outbound links they clicked.
- Every goal they completed, marked with a Goal badge.
- Every payment, with the amount marked clearly.
This is where attribution stops being abstract. You can watch someone arrive from ChatGPT, read three articles, leave, come back a fortnight later, and buy.
It is also where improvement work starts. Open a few non-buyers and patterns appear: the page where sessions end, the pricing visit with a ten-second stay, the checkout that was reached and abandoned. The Exit page report tells you where people leave in aggregate; a visitor’s story shows you what that looks like one person at a time.
Note: page views are kept for 90 days, but payments and visitor totals are kept forever. For an older visitor you will still see their profile and their payments, but the individual pages they viewed may have been cleaned up. Loggle tells you when that has happened rather than showing you a gap.
The names are invented — that is the point
Loggle stores no names, emails, or IP addresses, so it cannot show you real ones. The name and coloured avatar on each row are generated from the visitor’s random identifier: the same visitor always gets the same face and name, but neither says anything about who they really are. It makes the list readable — “Coral Stork bought again” beats a 32-character code — without collecting a single piece of personal data. The real identifier is still shown in the story for support and WP-CLI use.
Conversion markers on the chart
Every sale is pinned on the dashboard chart as a small disc carrying the icon of the channel that earned it — you can see at a glance when the money arrived and which channel deserves the credit. Hover for the amounts; click to open that buyer’s story directly. Sales in the same period group into one disc with a count, and refunds ride along as negative amounts so the chart never overstates.
Markers follow your attribution setting: on first-click they wear the channel that found the customer, on last-click the channel of the final visit.
Custom goals
Since Loggle 1.3.0, payments are not the only wins you can count. A goal counts an event — a newsletter signup, a visitor reaching your thank-you page — with no money attached. You build goals right on the Goals tab of the Visitors panel: click New goal, pick a page from your most-visited suggestions or type any path, and it saves instantly. The tab shows completions per goal, and clicking a goal reveals which channel drives it. Goal completions also appear in each visitor’s story with a Goal badge, and they never touch your revenue numbers.
The full guide, including WooCommerce presets and the developer methods: Loggle Custom Goals.
Comparing periods
A number on its own means little. £1,200 revenue is only good or bad next to what came before.
Turning comparison on
- Choose your date range.
- Click vs previous next to the range buttons.
Each headline number gains a percentage change, and the chart adds a dashed line for the earlier period.
How the comparison period is chosen
Loggle always uses the period of equal length immediately before the one you are viewing. Viewing the last 30 days compares against the 30 days before that.
Reading the colours
Green is good, red is not — and Loggle knows which direction is good for each number. A falling bounce rate shows green, because fewer bounces is an improvement.
Note: if the earlier period has no data at all, Loggle shows no percentage rather than an invented one. Comparison is unavailable on the Lifetime range, since nothing precedes it.
Stepping through past periods
The ‹ and › arrows beside the range buttons shift the whole dashboard back and forward by one window at a time — last month, the month before, and so on. The dates in view appear under the page title.
For an exact custom window, such as a single campaign week, use WP-CLI:
wp loggle summary --from=2026-07-01 --to=2026-07-31
Add --compare to see the previous period alongside it. The same options work with wp loggle report and wp loggle timeseries. The visitor list is wp loggle journeys, and --scope=all lists everyone instead of converters only.
Tips
- Sort the Channel report by RPV once a month. It often reorders your priorities.
- Check whether AI (referred) is growing. It is the fastest-changing channel on most sites right now — and the AI-crawler report shows the bots reading you before the humans arrive.
- Use Exit page to find where people give up before buying, then open a few of those visitors in the All tab to watch it happen.
- Click the marker on any unusually large sale to see what actually led to it.
Next steps
Adjust how Loggle works in How to Change Loggle Settings, or confirm everything is recording in How to Test Whether Loggle Is Working.